Reprinted from American Laboratory News August 1996
BY GLENN N. MERBERG
Evaluation of an octane analyzer
THE OCTANE NUMBER associated with a motor fuel is a measure of the performance
of that fuel. The number does not correspond to the concentration of any
one constituent in the fuel, but rather to the preignition properties of
the fuels as compared with standard fuel mixtures. The term "octane
number" is derived from the fact that the standard fuels contain isooctane.
The ASTM Standard Procedures for determination of octane numbers require
the use of two Waukesha co-operative Fuel Research (CFR) engines (Waukesha
Engine Div., Dressier Industries, Inc., Waukesha, WI). The Research Engine
runs at 600 rpm, with a controlled air mixture and temperature as defined
in ASTM D 2699. The Motor Engine runs at 900 rpm, with a controlled air
mixture and temperature and controlled fuel temperature as defined in ASTM
D 2700. These engines, or "knock engines," necessarily consume
the fuel sample and a series of standard fuels during the test procedure.
The octane number of a fuel is defined by the compression at which the
knock intensity of that fuel is 50% of the maximum knock intensity for
the engine. Pure isooctane is defined as having an octane number of 100,
while heptane is defined as having an octane number of 0. A series of standards
containing heptane, isooctane, and toluene are used to define a scale between
these two bounds. The research octane number (RON) of a fuel is the octane
number measured on the Research Engine. Similarly, the motor octane number
(MON) is the number determined by the Motor Engine. The octane number typically
posted on the pump at a service station is the average of the RON and MON
(called antiknock index [AKI], or [R + M]/2).
An octane analyzer
The ZX 101C (JSITS, Inc., Hagerstown, MD) is a portable, battery-powered
octane analyzer for use with gasoline. It consists of three primary components:
the analyzer, a sample container, and a light shield. The entire package
in a carrying case weighs less than 5 kg. The instrument performs an octane
number determination in less than I min and does not require the use of
standard samples. The measurement is completely nondestructive.
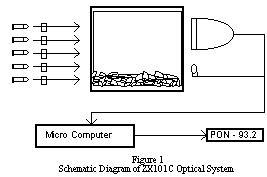 The
analyzer measures octane number via near-infrared (NIR) transmission spectroscopy.
The instrument contains a patented solid-state optical system comprising
14 near-infrared emitting diodes (IREDS) with narrow bandpass filters,
a silicon detector system, and a fully integrated microprocessor. Figure
1 shows a schematic representation of the analyzer. The sample holder
is a scaled, flat-sided, reusable glass container with an optical pathlength
of 75 mm. The sample volume is approx. 225 mL.
The
analyzer measures octane number via near-infrared (NIR) transmission spectroscopy.
The instrument contains a patented solid-state optical system comprising
14 near-infrared emitting diodes (IREDS) with narrow bandpass filters,
a silicon detector system, and a fully integrated microprocessor. Figure
1 shows a schematic representation of the analyzer. The sample holder
is a scaled, flat-sided, reusable glass container with an optical pathlength
of 75 mm. The sample volume is approx. 225 mL.
To make an octane number determination, the user acquires a background
signal from the empty sample chamber, measures the absorption spectrum
of the sample twice, then acquires a second background signal. The entire
process requires less than I min and can be performed by untrained, unskilled
personnel.
NIR spectroscopy
The NIR spectral region is usually defined as that portion of the spectrum
with wavelengths in the range 700-2500 nm. In this spectral region, overtone
frequencies of molecular vibrations absorb light quite readily. Because
the overtone absorption bands are typically wide and overlapping, spectroscopists
cannot merely measure peak heights to perform quantitative analysis. Instead,
multivariate regression analyses are utilized to correlate spectral features
with concentrations or physical properties of interest.
The ZX101C operates in the short-wavelength NIR, from 800 to 1100 nm
wavelength. The instrument is factory calibrated to predict octane number
(RON, MON, and PON) from the absorption spectra of the fuels being tested.
This prediction is accomplished through the use of a multivariate regression
equation of the form:
Octane number = K0 + K1 (OD1) + K2 (OD2)...+ K14 (OD14) + K15
(Ta)
where K0 is a bias term, K1 through K15 are slope coefficients, OD1
through OD14 are the absorbencies measured at each of the 14 wavelengths,
and Ta is the ambient temperature at the time of the test. The instrument
can store up to 10 calibration equations and is factory calibrated for
RON, MON, and PON of blended gasolines.
Analyzer features
The analyzer has several features that safeguard against erroneous readings:
high variance warning - triggered if repeat measures for a given sample
exceed some preset value; temperature warning - triggered if the analyzer
is used outside of the recommended temperature range (15-45 degrees Celsius):
out-of-range warning - triggered if the sample being tested is outside
the calibration range of the analyzer, and curve checking - triggered if
the optical spectrum of the current sample is atypical of gasoline samples
stored in the unit.
Limitations imposed by CFR engine testing
Quantitative NIR spectroscopy is a secondary technique, in that results
are generated through regression equations that model the output of some
primary method of analysis. In the case of octane testing, the primary
method of analysis is the CFR engine.
A secondary method can never show better accuracy than the precision
of the primary method. This is true because accuracy cannot be determined
beyond the bounds set by the primary method. In the case of CFR engine
testing, the limitations are as summarized in Table 1. In this context,
reproducibility describes the ability of an engine to generate the same
result for a given' fuel after being shut down, then restarted and used
by a new technician. Repeatability describes the ability of an engine to
generate the same result for a fuel sample in successive tests. The 95%
confidence interval corresponds to roughly two times the standard deviation
of measurement for large numbers of retests.
ASTM specifications for CFR testing
|
|
As per procedure |
Reproducibility
(95% confidence) |
Repeatability
(95% confidence) |
Octane number |
| RON |
2699 |
+/- 0.7 |
+/- 0.2 |
95 |
| MON |
2700 |
+/- 0.9 |
+/- 0.3 |
85 |
Table 1
Validation studies
State-sponsored octane screening
An increasing number of state governments are requiring filling stations
to undergo octane testing. Stations caught selling fuels with octane numbers
significantly different from the values posted on the pumps are fined and,
in some cases, closed down.
In a traditional test, gasoline samples are collected from various filling
stations and brought back to the laboratory for testing on CFR engines.
The testing is necessarily time consuming and expensive. For this reason,
many states have begun using the ZX 101C to perform on-site octane screening.
The analyzer makes octane determinations in seconds and eliminates the
tremendous expense of CFR testing.
During one recent survey, the state of Maryland Motor Fuel Testing Laboratory
(Jessup, MD) collected 161 gasoline samples from various filling stations.
The samples were each measured with the analyzer and then tested on both
the Research and Motor CFR engines. Figures 2,3, and 4 contain scatterplots
of the RON, MON, and PON of these samples as measured by the analyzer and
CFR engines. A statistical summary of the data is presented in Table 2..


In an independent survey, the Commonwealth of Virginia Motor Fuel Laboratory
(Richmond, VA) collected 163 gasoline samples. As with the Maryland study,
the samples were brought to the state laboratory and tested with the analyzer
and CFR engines. Figure 5 shows the calculated PON as measured with the
analyzer and the CFR engines. A statistical summary of the data is presented
in Table 2

The results of both of these validation studies show that the analyzer
provides sufficient accuracy for the screening of gasoline samples from
filling stations.
Octane exchange groups
Laboratories that make use of CFR engines typically belong to one or
more octane exchange groups (OEGs). These groups circulate gasoline samples
to the member laboratories and compile statistics about the octane numbers
determined for similar samples by different laboratories. The purpose of
the exchange groups is to allow laboratories to confirm that their engines
are generating accurate data.
JSITS recently participated in one OEG's roundrobin test. A set of
20 samples was provided to the company with no laboratory data. The samples
were measured on the analyzer, and the results returned to the OEG.
Later, the compiled laboratory values for RON and MON as determined
by the OEG were returned to the company. Scatterplots for RON, MON, and
PON, as determined by both the analyzer and the OEG, are shown in Figures
6, 7, and 8, respectively. A statistical summary of data is
presented in Table 2.


Because the initial calibration in the analyzer was performed with one
set of CFR engines; it is possible that the instrument may produce results
that have a relative bias to other sets of CFR engines. For this reason,
the analyzer is generally slope and bias corrected upon installation to
provide results that are compatible with the customer's CFR engines. The
OEG round-robin test did not afford JSITS the opportunity to perform slope
and bias correction, because it was a blind test. However, after the test
was complete and the analytical values for all the samples were known,
slope and bias corrections were performed. The statistics presented for
the corrected data reflect a best-fit regression performed between the
CFR engine values and ZX 101C predicted values. The OEG data are provided
on an as-is basis and with correction for slope and bias adjustment.
| Summary Of validation studies |
| Test Site |
Test type |
Standard error
of estimate |
Correlation |
| Maryland |
RON |
0.55 |
0.97 |
|
MON |
0.59 |
0.95 |
|
PON |
0.46 |
0.98 |
| Virginia |
PON |
0.49 |
0.98 |
| OEG |
RON |
0.66 |
0.98 |
|
MON |
0.47 |
0.98 |
|
PON |
0.47 |
0.98 |
OEG
(slope and
bias corrected) |
RON |
0.45 |
0.99 |
|
MON |
0.39 |
0.99 |
|
PON |
0.30 |
0.99 |
Table 2
Precision studies
In order to assess the precision of the analyzer, the author obtained
an instrument from the manufacturer and performed two experiments. In the
first test, a single user tested a single sample 25 times in succession.
The second experiment utilized five different technicians to test a single
sample five times each. For each experiment, the mean, standard deviation,
and range were calculated. Tables 3 and 4 summarize the results
of these tests. The 95% confidence intervals are calculated using a Student's
t distribution with 24 degrees of freedom.
| Precision study: 25 retests by a single user |
|
RON |
MON |
(R+M)/2 |
| Mean value |
98.4 |
87.9 |
93.2 |
| 95% confidence |
+/- 0.25 |
+/- 0.12 |
+/- 0.12 |
| Maximum reading |
98.6 |
88.1 |
93.3 |
| Minimum reading |
98.2 |
87.8 |
93.1 |
Table 3
Precision study: 25 retests
(five by each of five users) |
|
RON |
MON |
(R+M)/2 |
| Mean value |
98.5 |
87.9 |
93.2 |
| 95% confidence |
+/- 0.25 |
+/- 0.12 |
+/- 0.10 |
| Maximum reading |
98.7 |
88.1 |
93.3 |
| Minimum reading |
98.1 |
87.8 |
93.1 |
Table 4
Summary
The analyzer was demonstrated to be an effective tool for the measurement
of octane number in gasoline samples. Three independent studies provide
validation of the instrument's utility. The instrument is extremely easy
to use, portable, fast, and cost-effective. A typical analysis takes less
than 1 min and requires no standard fuels and no experienced personnel.
In general, the users seemed extremely satisfied with the analyzer and
had already integrated the instrument into their regular octane testing
program. Many commented that the analyzer provided cost savings by drastically
reducing the number of CFR engine tests.
Reference
1. ASTM Procedures D 2699 and D 2700. 1995 Annual Books of ASTM Standards,
Vol 5.02, 1995.
The data described herein were collected by independent laboratories,
with the exception of the precision data, which were collected by the author.
Dr. Merberg is an Independent Consultant, 18004 Archwood Way, Olney, MD
20832. U.S.A.: tel.: 301-570-3246: email: gmerberg@aol.com. The author
thanks Michael Jordan (Maryland Fuel Test Laboratory, Jessup, MD) and William
Fowler (Commonwealth of Virginia Motor Fuels Laboratory, Richmond, VA)
for sharing the results of their testing.
JSi@JSiTS.com